1. Project Title & Company Review
BrightCart Online Retail: Maximizing Online Retail Performance: Analyzing traffic patterns by time and source for BrightCart Online Retail.
INDUSTRY: E-commerce.
BrightCart Online Retail is a fast-growing e-commerce company specializing in consumer electronics, home goods, and lifestyle products. Founded in 2010 by a group of tech entrepreneurs, BrightCart aimed to simplify online shopping by offering an intuitive, personalized shopping experience with fast delivery and competitive pricing.
BrightCart operates primarily in the U.S. market, with a growing international presence in Canada and the U.K. Its customer base includes tech-savvy millennials, young professionals, and families seeking convenience and quality in online shopping.
ROLE: Operation Analyst/Supply Chain Analyst.
2. Business Problem
BrightCart experiences significant fluctuations in website traffic depending on the time of day, day of the week, and marketing campaign timing. The company also lacks comprehensive insights into the sources of this traffic—whether users are coming from organic search, paid ads, social media, or email campaigns.
Key Challenges:
- Traffic Timing Uncertainty: Without analyzing peak engagement hours, BrightCart struggles to schedule promotions, email campaigns, and website updates effectively.
- Traffic Source Analysis: Marketing resources are not optimally allocated because the company cannot accurately measure the ROI of each traffic source.
- Conversion Optimization: High traffic at suboptimal times may not convert efficiently, leading to wasted marketing spend.
- Customer Behaviour Insights: Limited understanding of when and from where customers interact with the platform reduces the effectiveness of personalization and targeted promotions.
3. Business Objectives
- Identify peak traffic times and low-traffic periods to schedule marketing efforts effectively.
- Analyze the sources of traffic (organic, paid, social, email) to measure channel effectiveness.
- Correlate traffic timing with conversion rates to optimize promotional campaigns.
- Segment traffic patterns by customer demographics and geographies for targeted marketing.
- Provide actionable recommendations to improve ROI from traffic sources and enhance overall website performance.
4. My Approach
- Data Collection into MS Excel.
- Data Preprocessing, cleaning using MS Excel.
- Exploratory Data Analysis (EDA) using Pivot Table in MS Excel.
- Imported the cleaned & processed Dataset into Tableau for visualization.
- Documentation & Recommendations.
TOOL USED: MS Excel & Tableau.
5. Key Deliverables
Delivered a Tableau dashboard to improve data-driven decision.
6. Insights
TRAFFIC BY DAY:
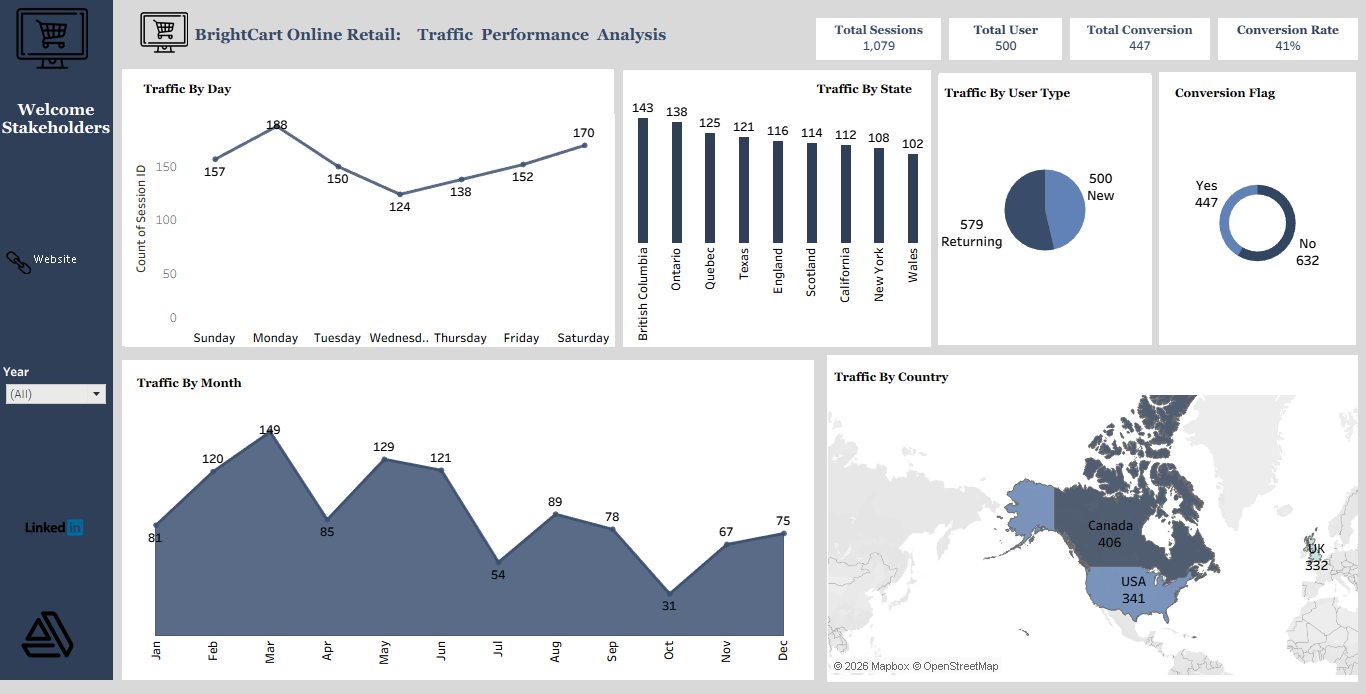
- Monday (188 sessions) and Saturday (170 sessions) record the highest traffic.
- Wednesday (124 sessions) is the lowest traffic day.
- Traffic dips mid-week and rises toward the weekend.
TRAFFIC BY MONTH:
- Traffic peaks in March (149) and May (129).
- October (31) and July (54) experience significant drops.
TRAFFIC BY STATE:
- British Columbia (143) and Ontario (138) generate the highest state-level traffic.
- Engagement gradually declines across other regions.
TRAFFIC BY COUNTRY:
- Canada (406 sessions) is the top traffic source, followed by the USA (341) and UK (332).
- BrightCart has strong traction outside its primary U.S. market.
TRAFFIC BY USER TYPE (New vs Returning):
- Returning users (579) exceed new users (500).
- This indicates good customer retention and brand loyalty.
CONVERSION FLAG (Yes vs No):
- 447 sessions converted, while 632 did not.
- A large volume of traffic still exists without completing purchases.
TRAFFIC BY DEVICE:
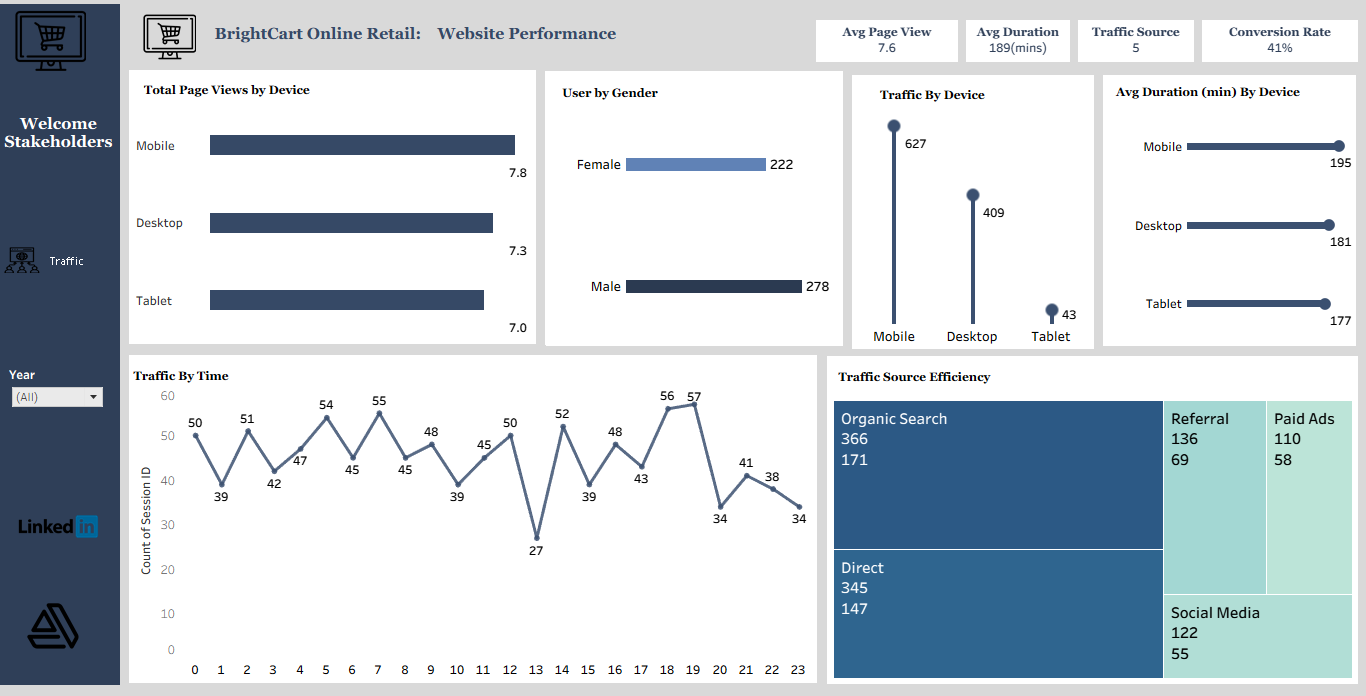
- Mobile devices dominate traffic (627 sessions).
- Desktop follows (409), while tablet traffic is minimal (43).
- Mobile users also have the highest average session duration (195 mins).
AVERAGE PAGE VIEW BY DEVICE:
- Mobile users view slightly more pages (7.8) than desktop (7.3).
- Tablet users have the lowest engagement.
TRAFFIC BY TIME (Hourly):
- Peak traffic occurs between 5 am to 8 am and 6 pm to 7 pm.
- A sharp dip appears around 2 pm.
TRAFFIC SOURCE EFFICIENCY:
- Organic Search (366) and Direct traffic (345) are the strongest sources.
- Referral (136), Social Media (122), and Paid Ads (110) contribute less traffic.
- Organic and Direct traffic also show stronger engagement and conversions.
7. Recommendations
- Schedule major promotions, flash sales, and email campaigns on Mondays and Saturdays, and reserve Wednesdays for maintenance, A/B testing, or brand awareness.
- Align inventory planning and marketing spend with high-performing months, and use discounts or partnerships during low months (July, October) to stabilize traffic.
- Run geo-targeted and localized marketing in high-performing regions, while using market research and localized content to grow weaker regions.
- Improve international strategy through better logistics, localized pricing, and country-specific marketing (currency, delivery expectations, promotions).
- Strengthen customer retention with loyalty programs, reward points, personalized recommendations, and referral incentives.
- Analyze exit pages and bounce rates, and improve product descriptions, page speed, and trust signals (reviews, guarantees).
- Focus on mobile-first optimization: seamless checkout, payment, navigation, product recommendations, and cross-selling. Tablet optimization can be a lower priority.
- Schedule email, push notifications, and paid ads during peak engagement hours, and avoid heavy spending during low-activity periods.
- Increase SEO and content marketing investment, refine paid ad targeting and creatives, and improve social media conversion funnels (not just engagement).