1. Project Title & Company Review
Cyclin'Gear Store: Driving Sales Optimization through Data-Driven Analysis.
INDUSTRY: Retail Industry.
Cyclin'Gear Store is a multinational retailer specializing in bike racks and cycling accessories across regions like Canada, USA, and Australia.
ROLE: Operation Analyst.
2. Business Problem
A multinational retailer in the cycling accessories market faces strategic blind spots in understanding its regional revenue performance, demographic appeal, product demand, and seasonal trends.
Without a clear view of its highest-performing regions and product segments, the company risks misallocating resources and missing growth opportunities. Leadership is looking to your data analysis to drive smarter decisions around marketing, product focus, and inventory planning.
3. Business Objectives
Challenges are as follows:
- Leadership needs data to refine regional marketing strategies, understand target demographics, manage inventory, and forecast demand.
- Uncertainty around which regions, age groups, and product types are driving sales performance.
- Difficulty anticipating demand cycles, leading to stock issues and missed promotional opportunities.
Develop a MS Excel dashboard for efficient data visualization and real-time decision support.
4. My Approach
- Data Collection & Preparation.
- Exploratory Data Analysis (EDA).
- Insight Generation.
- Reporting & Visualization.
- Recommendations.
TOOL USED: MS Excel.
5. Key Deliverables
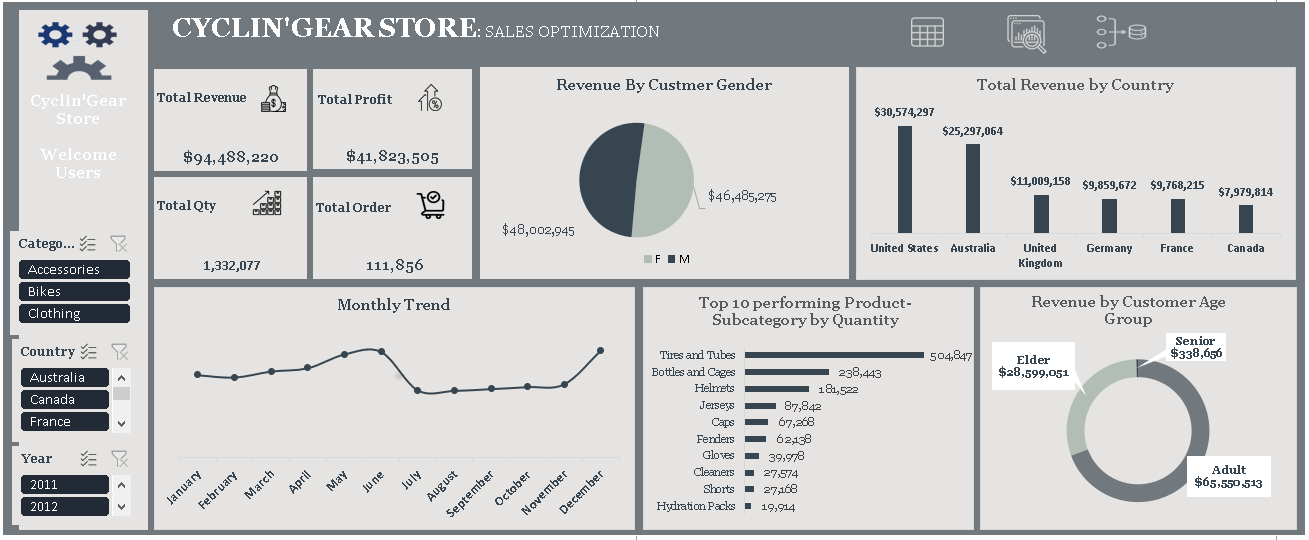
Delivered a MS Excel dashboard to improve data-driven decision-making.
6. Insights
- The United States generated the highest revenue of $30,574,297; next to this is Australia with a revenue of $25,297,064 and the least revenue was generated by Canada with $7,979,814.
- Customers within the Adult age group generated the highest revenue of $65,550,513; next to that is the Elder with revenue of $28,599,051 and lastly is Senior with revenue of $338,656.
AGE GROUP: ADULT ≤ 40yrs; ELDER ≤ 64yrs & SENIOR ≥ 65yrs.
- Based on the monthly trend of the revenue across the years. The month of December generated the highest revenue of $10,108,767 and next to that is June with a revenue of $9,9985,692.
- 51% of the customer gender which are male generated the highest revenue of $48,002,945 while the remaining 49% of the customer gender, female generated revenue of $46,485,275.
7. Recommendations
- With improved revenue generated in the USA, Australia, promotional resources should be employed to boost sales and for underperforming regions, like: UK; Germany; France & Canada marketing campaigns should be implemented to improve sales.
- Based on the product category: Accessories, Bike & Clothing. The following subcategories of products must be in stock as they are part of the top 10 performing products: Tires & Tubes, socks, helmet, bottle & cages, fenders, jersey, caps, road bike, mountain bike and touring bike.
- Investigate should be carried out on months with high sales to determine if seasonal change were the cause or it was due to discount, if so, find how we can model other months in the years just like it.