1. Project Title & Company Review
Digital Ad Genius: Maximizing E-commerce Impact with Precision Digital Marketing Analytics
INDUSTRY: FMCG
FreshCart, like many e-commerce platforms, relies heavily on online advertising to acquire new customers and retain existing ones. As the competition in the online grocery sector has skyrocketed, the cost of customer acquisition is rising.
FreshCart is looking for the most efficient way to save cost and optimize its digital Ad spend.
ROLE: Marketing Data Analyst.
2. Business Problem
However, in the midst of an increasingly competitive market and fluctuating Ad costs, the company has identified two main challenges:
- Inefficient Ad Spend: The company suspects that not every dollar spent on digital advertising is yielding the desired ROI. Some campaigns may be costing more than they return in revenue.
- Identifying Effective Channels: With multiple platforms available for advertising, from search engines to social media, FreshCart is finding it challenging to determine which channels offer the best return on investment.
3. Business Objectives
This project aims to analyze FreshCart past advertising data and create a strategy to optimize its digital Ad spending. The specific objectives are:
- Evaluate the effectiveness of current advertising campaigns across platforms.
- Identify top-performing channels for advertising.
- Assess demography, engagement, and conversion rates.
- Recommend strategies for better budget allocation.
4. My Approach
- Data Integration: I connected the Excel (data source) to Power BI.
- Data Cleaning: Clean data and transform it to the required format in Power Query.
- Data Modeling: Create data models of the tables in Power BI.
- EDA & Visualization: Analyze data, define KPIs, and visualize it in Power BI.
- Reporting & Recommendations: Write a report of the analysis and provide recommendations.
TOOL USED: Power BI
5. Key Deliverables
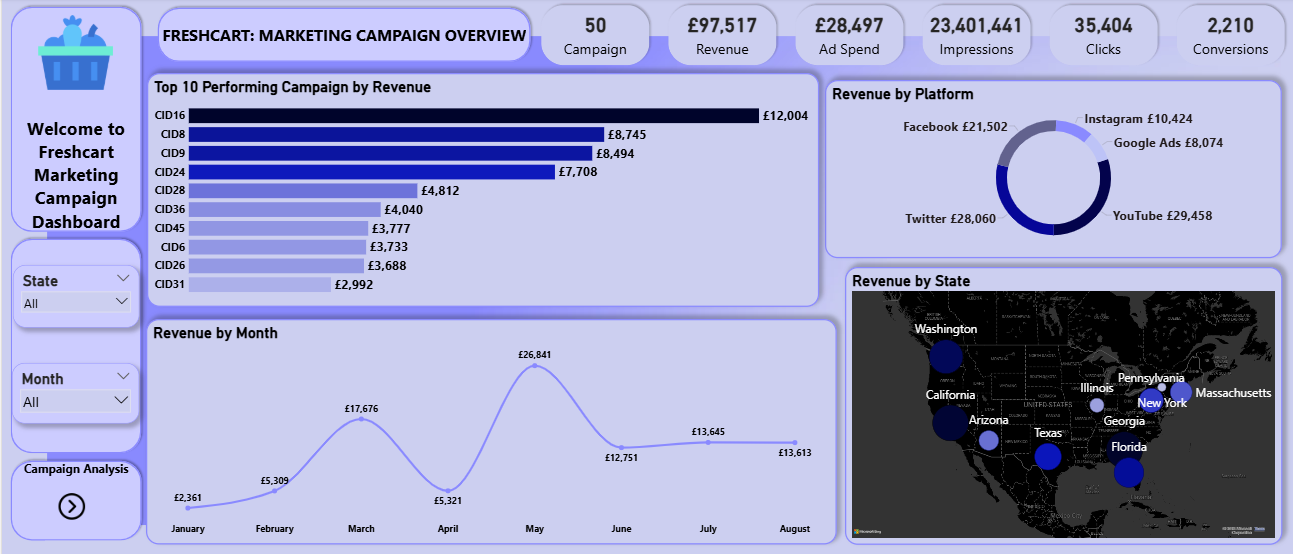
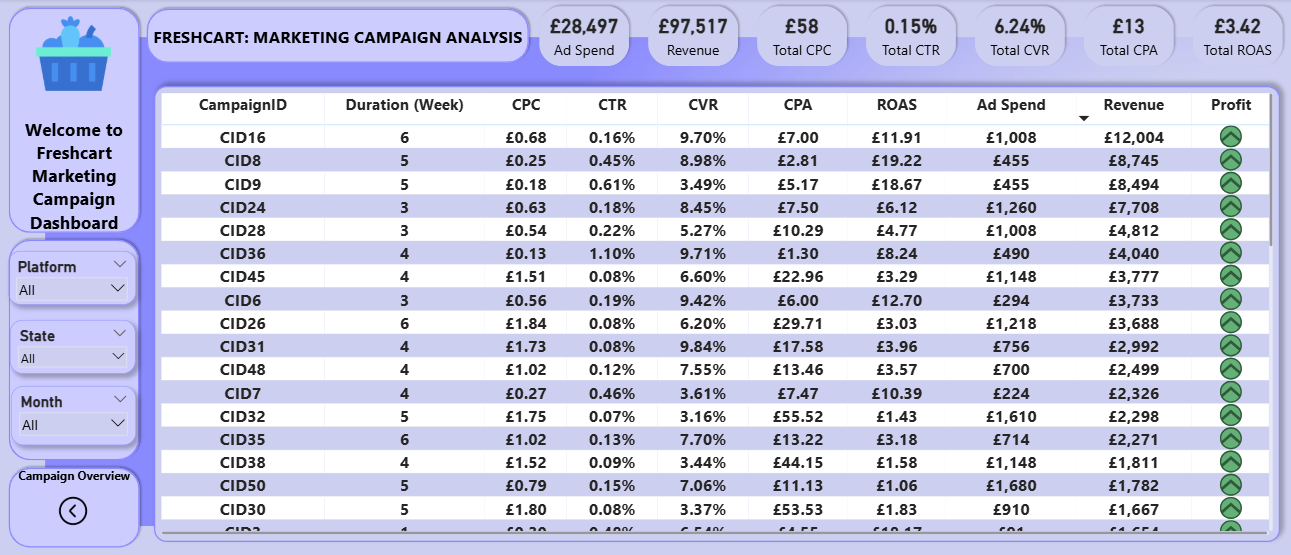
Delivered a Power BI dashboard to improve data-driven decision.
6. Insights
- The top 10 performing Campaign based on Revenue: CID 16 (£12,004); CID 8 (£8,745); CID 9 (£8,494); CID 24 (£7,708), CID 28 (£4,812); CID 36 (£4,404); CID 45 (£3,777); CID 6 (£3,733); CID 26 (£3,688) and CID 31 (£2,992).
- YouTube made the highest Revenue of £29,458, which is 30.2% of the total revenue. Next is Twitter, £28,060, Facebook, £21,502, Instagram, £10,424 and Google Ads, £8,074.
- The best performing States in Revenue are Georgia, California, Washington and Florida, with a revenue of £67,281, which is 69% of the Total Revenue (£97,517). The rest of the State: Texas, Pennsylvania, Massachusetts, Arizona, Illinois and New York make up £30,236, which 31% of the Total Revenue.
- FreshCart experienced the highest sales in May: £26,841. Before May, sales had a steady increase from January at £2,361 to March at £17,676, before a decline in Sales in April at £5,321. After May, Sales dropped again in June (£12,751) with little increment at the end of August (£13,613).
7. Recommendations
- EVALUATE THE EFFECTIVENESS OF CURRENT ADVERTISING CAMPAIGN ACROSS PLATFORM
• Using ROAS & CPA as a criterion to evaluate the Business Success, the following campaigns were effective: CID 16, 8, 36, 6, 9, 12, 17, 3.
• Using CVR as a criterion to evaluate Ad quality, the following campaigns were effective: CID 16, 8, 36, 6, 31, 46, 11, 33, 5, 13.
- IDENTIFY TOP-PERFORMING CHANNELS FOR ADVERTISING
• Based on metrics like ROAS, CPA, CVR, CTR, CPC, Ad Spend and Revenue. YouTube is the best platform; promoting just 9 campaigns, which all together performed well. In relation to the Revenue generated, YouTube had the lowest Ad Spend.
• Next is Twitter, promoting 12 campaigns with the highest CVR among other platforms.
• Finally, Facebook is also an excellent platform for Ad promotion.
• A/B Testing analysis should be implemented on Instagram and Google Ads to examine and improve their overall performance.
- ASSESS DEMOGRAPHY, ENGAGEMENT, AND CONVERSION RATES
• California has a total 0.17% CTR (engagement) and 8.45% CVR (conversion rate); this indicates that the campaign's quality converts a lot of customers. In addition, it is one of the locations that performed well in terms of sales.
• Despite poor Revenue, Pennsylvania had a good CVR 7.22%.
• Campaign quality that did well in other locations can be implemented in locations like New York and Illinois that had poor engagement and low conversion.
- RECOMMEND STRATEGIES FOR BETTER BUDGET ALLOCATION
• In terms of Location, the budget can be allocated to Georgia, California, Washington and Florida. Other States that are performing poorly in other metrics, but well in CVR, should be examined properly using A/B Testing on a small scale before upscaling their Ad budget.
• Campaigns that performed badly should be modelled after the campaigns that did well in all parameters to improve their overall performance. It will suffice to say that when poor campaigns are fixed, it will ultimately affect Months that had low revenue.
METRICS:
ROAS:- Return On Ad Spend.CPA:- Cost Per Acquisition.
CVR:- Conversion Rate.
CTR:- Click Through Rate.
CPC:- Cost Per Click.
Revenue.
Ad Spend.